Why Email Security Forecasts Disagree And What Buyers Should Fund

Quick Answer
Email security forecasts often disagree because they use different data, threat assumptions, and market projections. Buyers should prioritize funding proven protection, phishing detection, AI-driven threat prevention, employee training, and continuous monitoring to strengthen long-term security.
Executive takeaway
Email security forecasts do not measure one consistently defined revenue pool. Their baselines, product boundaries, forecast periods, and deployment shares differ. The supplied evidence cannot fully explain those differences or identify a definitive estimate. Buyers should use forecasts to question market assumptions, not set spending targets. Fund documented gaps across authentication, threat protection, delivery, routing, and response. Require vendors to demonstrate relevant capabilities and clarify operational responsibilities. Neither a large market forecast nor enthusiasm for defensive AI proves that a purchase will improve security.
The Market Number Depends on Who Is Counting
The forecast disagreement begins with the baseline, not the distant future. Straits Research estimates the 2025 email security market at USD 5.30 billion, versus OG Analysis’s USD 7.19 billion. What can buyers learn from such different estimates of the same year?
Start by aligning years while keeping differences in scope visible. Four selected estimates illustrate the spread:
- Straits Research: USD 5.30 billion in 2025.
- Fortune Business Insights: USD 5.46 billion in 2025.
- Market.us: USD 6.36 billion in 2025.
- OG Analysis: USD 7.19 billion in 2025.
The highest exceeds the lowest by USD 1.89 billion—approximately 36%, calculated from these reported baselines. This is a comparison of selected estimates, not the full range of available forecasts. It shows that disagreement precedes any long-term growth assumptions.
Forecast endpoints introduce another distinction: both the amount and its year matter. Straits projects USD 14.82 billion by 2034, while Fortune projects USD 14.44 billion by 2034. OG Analysis projects USD 18.1 billion by 2034; Market.us projects USD 27.58 billion by 2035.
Comparing these totals without their dates would obscure differences in forecast duration. Compound annual growth rate, or CAGR, expresses compounded growth as an equivalent, steady yearly percentage. It does not predict identical increases every year. Straits reports 12.10% and Fortune 11.5% for 2026–2034; OG Analysis reports 10.8% for 2025–2034. Market.us reports 15.8% for 2025–2035. These are reported rates, not independently validated calculations.
A separate trends and forecast summary reports 8% CAGR for 2025–2031. Across these summaries, 8%–15.8% describes differing forecasts, not a consensus estimate or statistical confidence interval.
Scope and methodology offer plausible explanations, but the supplied evidence cannot establish their contribution to the gap. Product boundaries, revenue-counting methods, and demand expectations could all differ. Larger estimates alone do not prove broader coverage or stronger demand.
This article compares supplied commercial research summaries rather than independently measuring market revenue. Its approach is to align years, distinguish categories, and preserve conflicting findings rather than average them. Buyers should first ask what each estimate includes and how the analyst constructed it.
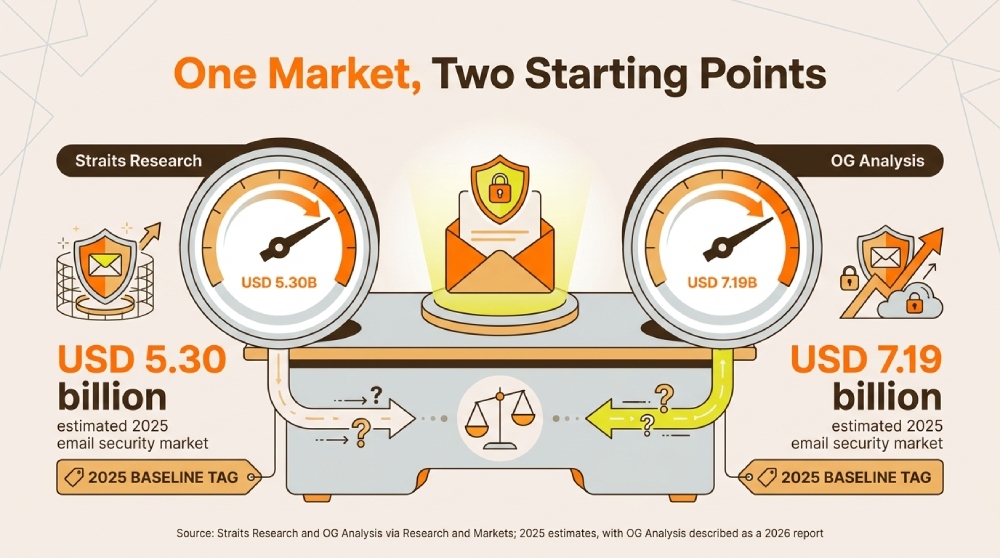
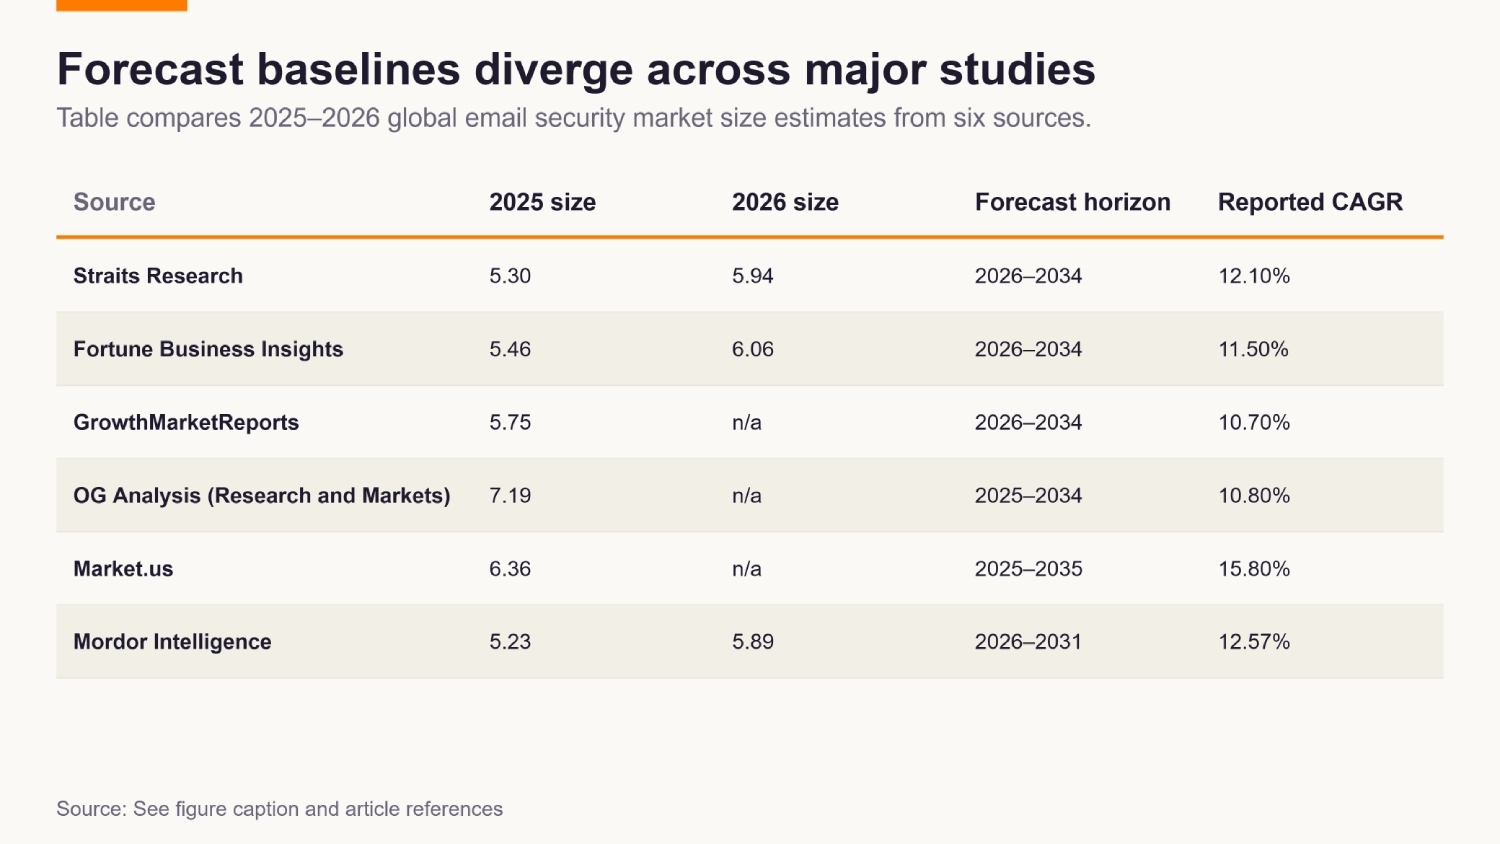 Key 2025–2026 email security market size estimates show a spread from roughly USD 5.23 billion to USD 8.1 billion, reflecting different scopes and methodologies. Method: Values are taken directly from published market reports and aligned by year; no averaging or adjustment is applied.[2][6][7][9]
What Counts as Email Security?
Email security covers overlapping capabilities, not a universally defined basket of products. Comparing forecasts requires checking the controls, communication channels, and operational services included.
Fortune Business Insights frames email security around gateways, spam filtering, malware detection, data loss prevention, encryption, and advanced threat protection. Its stated scope centers on email communications rather than broader enterprise collaboration protection.
Separating a control’s purpose from its operating environment makes these boundaries easier to assess:
- Gateway filtering screens messages passing through email infrastructure for unwanted or malicious content.
- Integrated cloud email security (ICES) integrates protection with hosted email environments rather than relying solely on gateways. Capabilities can include post-delivery detection and account-takeover protection.
- Encryption protects message confidentiality, while filtering addresses unwanted or dangerous content. Fortune includes encryption within its scope, so it is not necessarily additional spending.
- Collaboration protection extends coverage beyond email to enterprise collaboration channels. Broader coverage does not necessarily require a separate purchase.
- Managed operations concern who monitors and operates protection, rather than which communication channel it protects.
Fact.MR’s messaging-security category takes a broader view, covering enterprise email and collaboration protection programs. It includes post-delivery detection and account-takeover controls in hosted environments. The supplied summary also describes workflows combining detection, mailbox search, and controlled response.
Fact.MR estimates this market at USD 11.2 billion in 2025, rising to USD 42.7 billion by 2036. It reports 13.0% CAGR over 2026–2036, starting from USD 12.6 billion in 2026. The growth period therefore differs from the full span between the quoted 2025 estimate and 2036 endpoint.
The larger messaging-security estimate does not quantify incremental collaboration spending. No reconciled breakdown separates shared email capabilities from additional collaboration coverage. Subtracting an email-security estimate from it would produce an unsupported budget figure. Adding the categories would risk double-counting.
The growth comparison in the figure needs the same caution: messaging security grows faster than some core forecasts, not all. Fact.MR’s reported 13.0% exceeds Fortune’s 11.5%, but Market.us reports 15.8% for email security over 2025–2035. Different horizons further limit a like-for-like comparison.
The useful distinctions are coverage, capabilities, and operational responsibility. An analyst category can encompass all three without representing three separate spending opportunities.
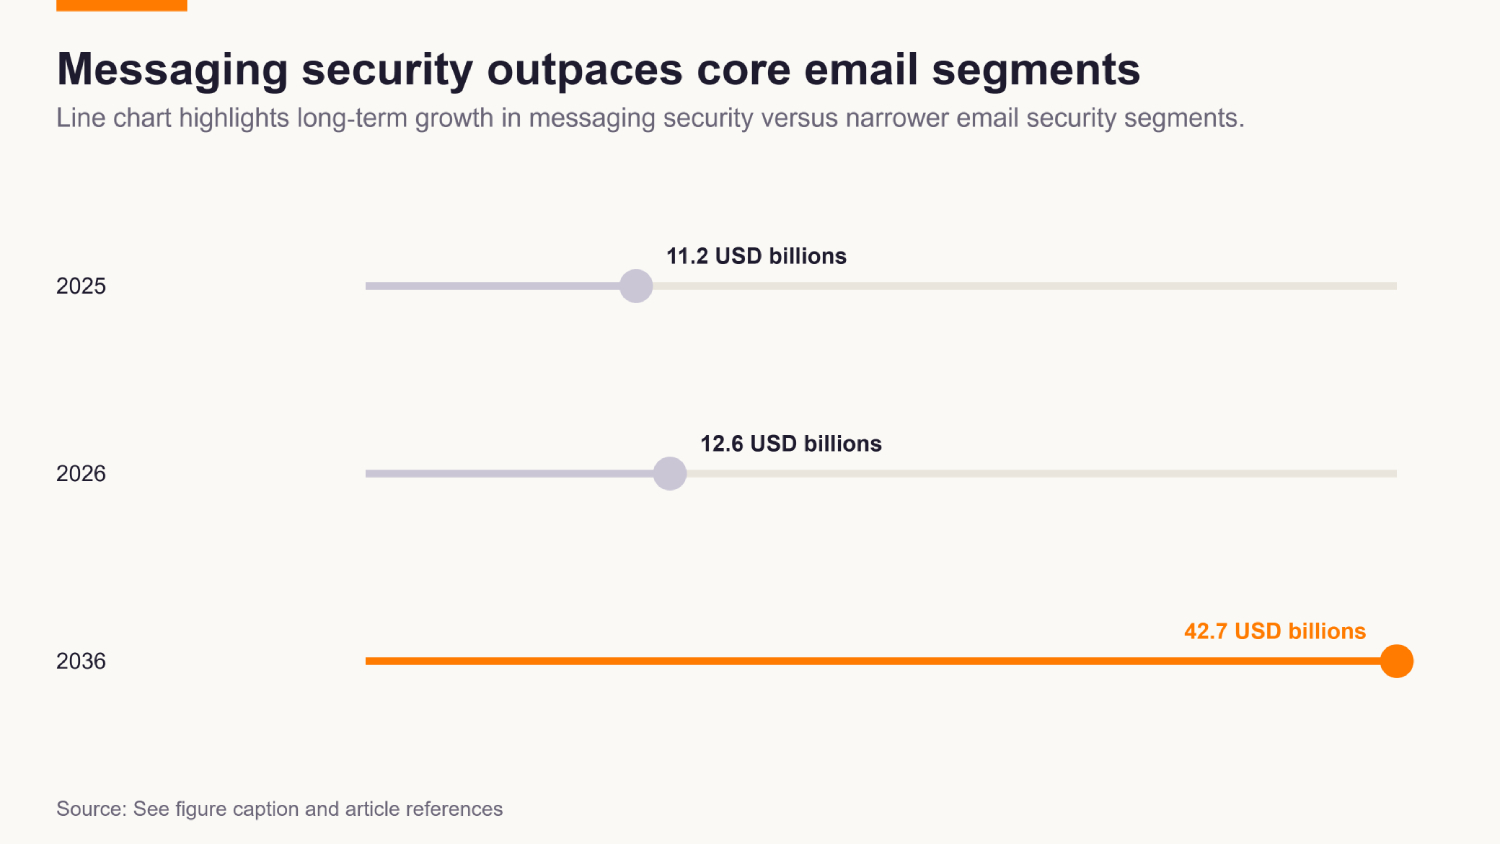 Messaging security revenues grow from USD 11.2 billion in 2025 to USD 42.7 billion by 2036, reflecting layered protection across email and collaboration channels. Method: Values are taken from Fact.MR’s messaging security market report; intermediate years are interpolated linearly for visualization only and do not represent official forecasts.[13]
Cloud Leads Some Estimates, but Not All
Cloud leadership is not a consensus finding across these estimates. Fortune Business Insights assigns cloud deployments 78.6% of global email security revenue in 2025. This describes Fortune’s estimated revenue mix, not a universally established deployment split.
Mordor Intelligence puts cloud’s 2025 share at 59.10%. That remains a majority, but suggests substantially less dominance than Fortune’s estimate.
Market.us presents a contrasting picture: on-premises deployments account for 57.4% of revenue in 2025. These estimates do not share a verified common denominator. Readers cannot combine them or reconcile them through subtraction.
The evidence does not establish which methodological choices explain this disagreement. Market boundaries and segmentation rules warrant scrutiny, but cannot simply be assumed to account for every difference. The conflict remains unresolved.
Revenue share also differs from new investment flows. Revenue can include continuing expenditure on existing deployments; its distribution does not establish where incremental spending goes. Fortune’s cloud figure therefore cannot, by itself, show that most new investment targets cloud-native products. Nor does revenue share measure the proportion of organizations using a cloud deployment model.
Component figures require a similar distinction between current scale and projected growth. Mordor’s component analysis assigns solutions—software and platforms—69.35% of revenue in 2025. It projects 15.02% compound annual growth for services through 2031. These figures describe different measures: one is market share; the other is a forecast growth rate.
Software can remain the larger category while services grow faster. Buyers should assess whether implementation, monitoring, and support need additional resources, rather than infer that services will replace software.
Regional estimates also vary. Fortune assigns North America 32.05% of 2025 revenue, compared with Market.us’s 37.2%. Mordor’s estimate reaches 41.05%. The spread reinforces the need to check coverage before using regional shares as benchmarks.
Before applying a headline figure, match its boundaries to the purchasing context:
- Deployment: cloud, on-premises, and treatment of hybrid environments.
- Component: software versus managed or professional services.
- Geography: relevant countries and regions, not global averages alone.
- Customer scope: organization size and industry coverage.
Only then can a benchmark inform planning. An unresolved difference in measurement should not become a confident recommendation about architecture.
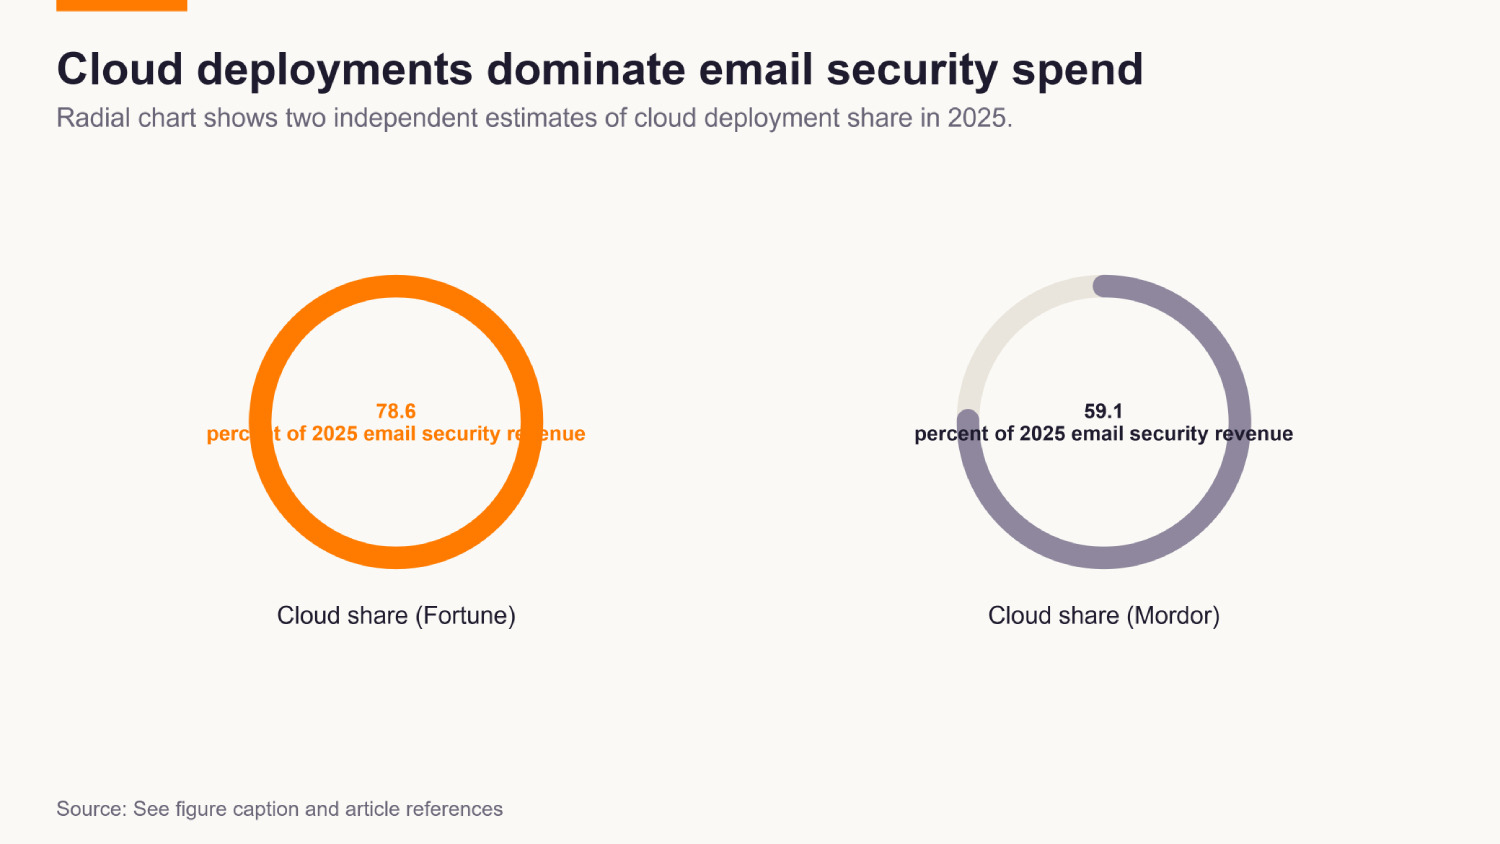 Cloud email security accounts for the majority of deployments, with shares between roughly 59% and 78.6% depending on the study. Method: Shares are taken from Fortune Business Insights and Mordor Intelligence; radial segments illustrate relative proportions without implying a unified dataset.[5][9]
Threat Pressure Explains the Search for More Layers
Buyer-reported threats reveal experiences and concerns, not future spending totals. In TitanHQ’s 2025 survey, 79% reported at least one cybersecurity incident during the previous 12 months. Respondents represented organizations using Microsoft 365 as their primary cloud email platform. The finding does not classify every incident as email-borne.
The survey also reported that one in eight organizations lost money through business email compromise, or BEC. BEC involves deceptive business communications used to induce actions such as fraudulent payments. Unlike expectations about future threats, this finding concerns reported financial loss. It still does not identify which controls would have prevented those losses.
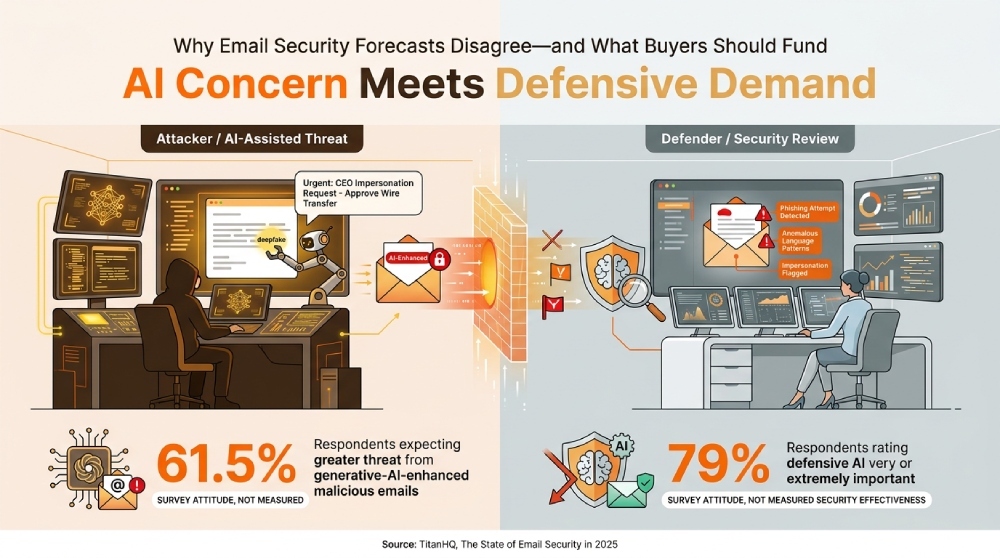
The infographic separates two AI findings that answer different questions:
- Concern about attackers: 61.5% expected increased threats from generative AI making malicious emails more plausible.
- Importance of defensive capabilities: 79% rated defensive AI in email security as very important or extremely important to their cybersecurity posture in 2025.
These responses describe anticipated threats and the value respondents attach to defensive AI. They do not measure purchasing commitments, detection accuracy, or comparative product performance. Concern about AI is not evidence of AI effectiveness.
Layered protection offers a way to organize evaluation, not an automatic prescription to buy more products. Its purpose is to assign complementary tasks to controls operating at different points:
- Gateway filtering screens messages before delivery for spam, malicious attachments, and other suspicious content.
- Post-delivery detection examines messages already inside mailboxes and can support removal of threats missed initially.
- Account-takeover controls address compromised accounts, including suspicious access or behavior beyond message content alone.
- Response workflows connect alerts with investigation, containment, message removal, and recovery. Each action needs an owner.
One platform may cover several roles. Additional products are justified only where evaluation identifies meaningful gaps and demonstrates useful coverage. Multiple tools performing the same task do not necessarily provide complementary protection.
TitanHQ’s vendor-published survey offers evidence about reported experiences and attitudes, not an independent product-performance comparison. It helps explain interest in additional protection but cannot establish that threat concerns cause market growth. Neither can it show that another security layer necessarily improves outcomes.
Choose Capabilities Around Your Business
Authentication, protection, delivery, and routing provide a planning framework—not proof of any vendor’s advantage. Use these functions to define communication requirements and responsibilities, rather than separate market opportunities.
- Authentication: Assess controls governing authorized use of sending domains. Sender Policy Framework (SPF) identifies permitted sending systems; DomainKeys Identified Mail (DKIM) provides a verifiable digital signature. Domain-based Message Authentication, Reporting, and Conformance (DMARC) checks alignment with the visible sender domain and communicates handling and reporting policies.
- Protection: Assess malicious-link, attachment, and impersonation detection alongside mailbox investigation and compromised-account response. Authentication does not establish that message content is harmless.
- Delivery: Define requirements for reliable delivery of legitimate messages and investigation of failures. Evaluate these operational outcomes separately from threat detection: successful delivery does not establish safety.
- Routing: Document message destinations, forwarding arrangements, and migration requirements. Assign configuration and troubleshooting responsibilities without treating routing flexibility as evidence of stronger security.
Industry forecasts provide context, but cannot determine an organization’s required spending. Mordor Intelligence estimates banking, financial services, and insurance represented 27.35% of 2025 revenue. It identifies healthcare as the fastest-growing vertical, forecasting 16.62% CAGR through 2031. Current revenue share and projected growth describe different dimensions of demand.
The growth ranking is not unanimous. MarkNtel Advisors instead identifies financial services as its highest-growth application segment. The supplied evidence does not reconcile these rankings or establish which better matches a particular buyer.
Translate sector context into requirements rather than budget ratios. Payment approvals may warrant particular scrutiny, while sensitive patient communications require clearly defined handling. These are planning examples, not spending prescriptions derived from market shares.
Managed services introduce a responsibility question, not a company-size category. TitanHQ’s 2025 report found that one in five organizations using managed service providers lost money through BEC during the previous year. This does not establish that those customers were small businesses or that outsourcing caused their losses. Without comparable groups and relevant controls, it cannot measure the effect of managed services.
For outsourced arrangements, specify who monitors alerts, investigates mailboxes, changes authentication records, and authorizes recovery actions. Evaluate escalation responsibilities alongside technical coverage. A service contract alone does not demonstrate that every operational gap has closed.
A Buying Guide That Starts with Risk, Not CAGR
Start with uncovered risks, not market growth. Inventory existing controls across authentication, protection, delivery, routing, and incident response. Record what they cover, where coverage remains uncertain, and which business processes depend on them.
Treat these functions as connected decisions rather than separate shopping lists. Can legitimate messages reach their destinations? Do suspicious messages receive appropriate handling? Can teams investigate and contain incidents? Prioritize gaps by business impact and evidence of exposure, not analyst category size.
Assign ownership before selecting additional tools. Name who configures policies, approves changes, investigates alerts, and coordinates recovery across internal teams and providers. Define escalation arrangements wherever responsibilities cross organizational boundaries.
Ask shortlisted vendors for a capability map against that inventory. Require them to identify native controls they supplement or duplicate, integration dependencies, and changes to daily work. Request demonstrations of policy changes, alert handling, and incident investigation rather than relying on feature lists.
Evaluate consolidation and specialist tools against the same requirements. Consolidation may simplify supplier management, but that alone does not establish better security. Compare coverage, administrative effort, dependencies, and response responsibilities without assuming either architecture wins.
Before approving a purchase, answer five questions:
- Coverage: Which documented risk does it address, and what remains uncovered?
- Ownership: Who maintains configuration and leads incident response?
- Overlap: Which existing capabilities will remain, change, or become redundant?
- Operations: How will integration affect investigations, alerts, delivery, and routing?
- Evidence: Can the vendor demonstrate relevant results in your environment?
Buyer enthusiasm can motivate evaluation, but cannot replace it. TitanHQ’s 2025 report describes strong interest in complementary protection among organizations using Exchange Online Protection. That finding does not prove additional layers are effective or that AI-branded products perform better.
For market claims, request the category definition, baseline year, forecast horizon, geography, and treatment of bundled services. Mordor Intelligence’s segmentation illustrates why component, deployment, and security-type distinctions matter. Clarify these boundaries before comparing dollars or growth rates; acknowledge uncertainty when methods remain unavailable.
Vendors should distinguish their reachable product opportunity from the broader messaging security market. Explain which capabilities and customer needs an offering serves. Overlapping category totals are not additive revenue opportunities.
Forecasts provide context, not proof that a purchase deserves funding. Documented risk coverage, operational fit, and relevant performance evidence should drive investment.
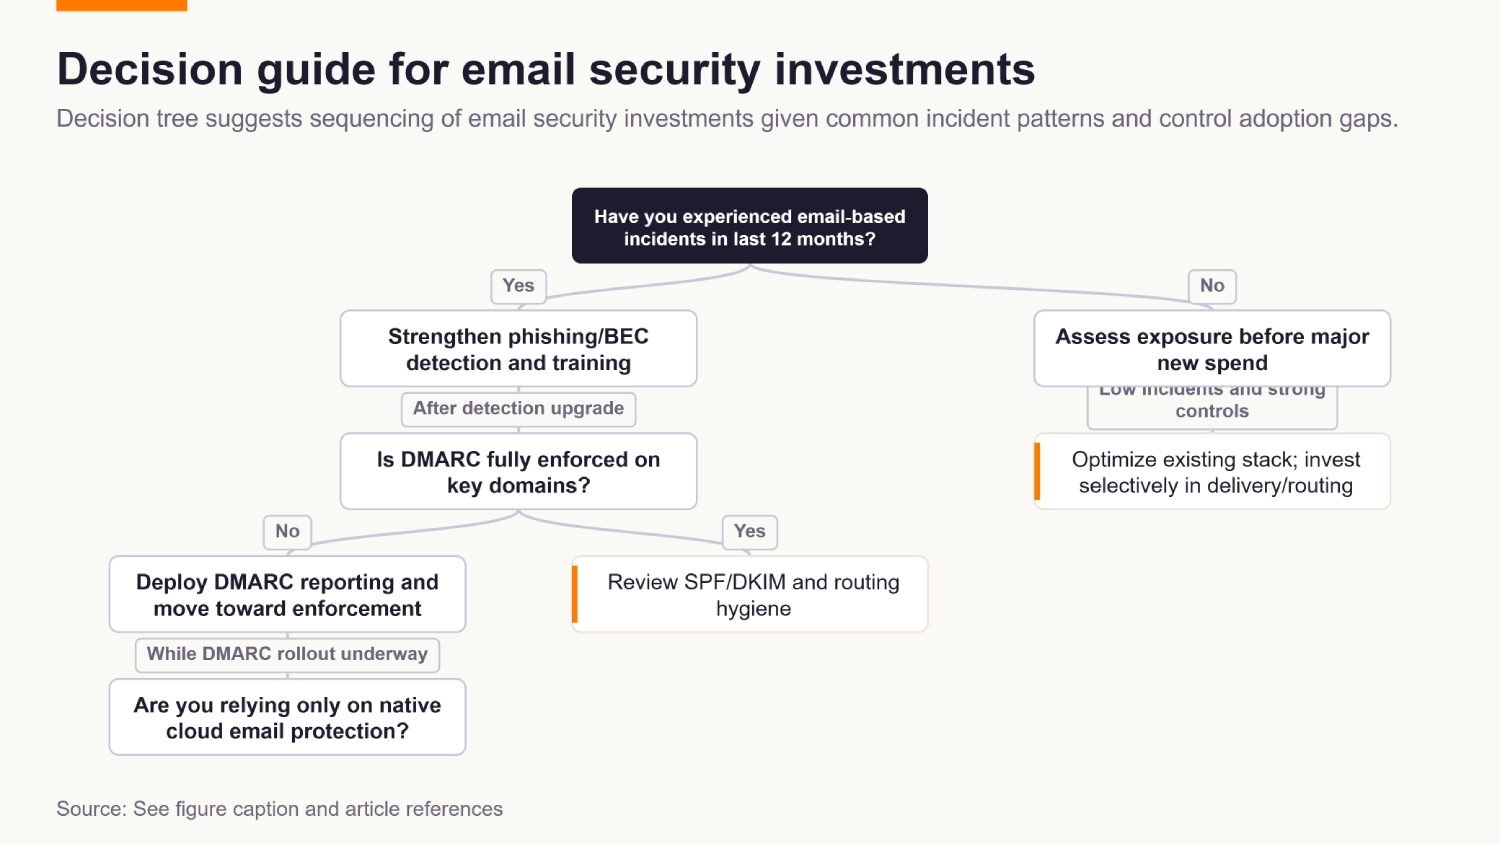 A practical decision tree helps buyers prioritize investments across authentication, protection, delivery, and routing based on incident history and current controls. Method: Nodes are constructed as an inference from threat statistics and typical control gaps; they do not represent a formal standard but a synthesized decision aid based on the research.[3][9][11]
Limitations
- This analysis checks claims against supplied summaries, not independently inspected source texts. Underlying forecast methods and survey documentation are unavailable.
- Market definitions, forecast periods, and segmentation differ. Estimates cannot be averaged, added, or subtracted meaningfully without reconciling their scope.
- CAGRs are reported figures, not independently validated growth models. The supplied evidence does not fully reconcile calculation conventions with stated endpoints.
- TitanHQ findings concern surveyed Microsoft 365 organizations. Reported incidents and attitudes do not establish product effectiveness, causation, or outcomes across all organizations.
- Unsupported vendor claims, missing encryption references, and misattributed managed-service estimates have been excluded. Remaining recommendations are planning guidance, not measured intervention results.
References
- Email Security Market Report: Trends, Forecast and …
- Email Security Market Size, Share, Growth, Analysis, 2034
- Email Security Market Size, Share | Industry Report 2026-2034
- Email Security market Size, Share & Growth Analysis Report
- Email Security Market Size, Share | CAGR of 15.8%
- Global Email Security Market to Reach USD 16.19 Billion by 2032 …
- Email Security Market Size, Growth | Share & Competitive …
- The State of Email Security in 2025
- Messaging Security Market, Global Market Analysis Report
Topics
General Manager
General Manager at DuoCircle. Product strategy and commercial lead across the email security portfolio.
Secure your email infrastructure
Protect, authenticate, and deliver. Contact our team to find the right solution.