How To Build An Email Infrastructure Monitoring Dashboard That Actually Prevents Outages

Quick Answer
Build an email infrastructure monitoring dashboard that tracks SMTP, SPF, DKIM, DMARC, queue health, delivery rates, and alerts in real time to detect issues early, prevent outages, and maintain reliable email delivery across critical business systems.
Email remains one of the most critical communication channels for modern businesses. Whether it’s transactional notifications, password resets, marketing campaigns, customer support communications, or internal correspondence, organizations depend on reliable email infrastructure and strong email security to operate efficiently. Yet many companies only discover email delivery problems, authentication failures, or security-related issues after customers begin complaining, support tickets start piling up, or revenue-impacting workflows fail.
The difference between a minor email issue and a major outage often comes down to visibility. A well-designed email infrastructure monitoring dashboard provides real-time insights into the health, performance, and security of your email ecosystem, allowing administrators to identify and resolve issues before they affect users.
However, not all dashboards are created equal. Many organizations build monitoring systems that collect data but fail to provide actionable intelligence. The goal should not simply be monitoring for monitoring’s sake—it should be preventing outages, strengthening email security, and ensuring consistent message delivery.
This guide explains how to build an email infrastructure monitoring dashboard that delivers meaningful visibility, proactive alerts, robust email security monitoring, and outage prevention capabilities.
Define What “Healthy” Email Infrastructure Looks Like
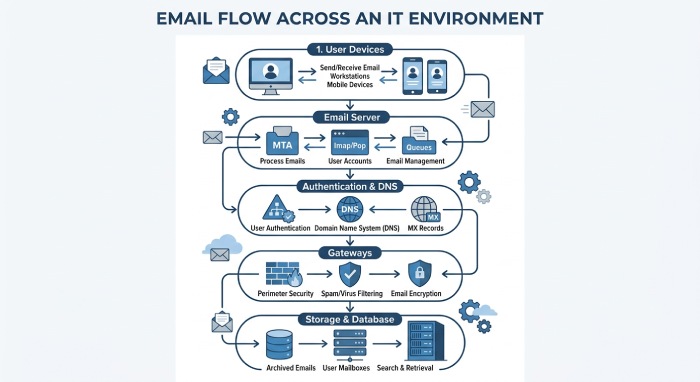
A useful email infrastructure monitoring dashboard starts with a clear definition of “healthy.” Too many teams build dashboards around whatever data is easiest to collect, then discover during an outage that the view did not show the failure path. Effective email monitoring should reflect how mail actually flows across your environment: from user devices and applications, through the email server, authentication systems, DNS, gateways, queues, storage, databases, and cloud or on-premises delivery services.
Map the full email delivery chain
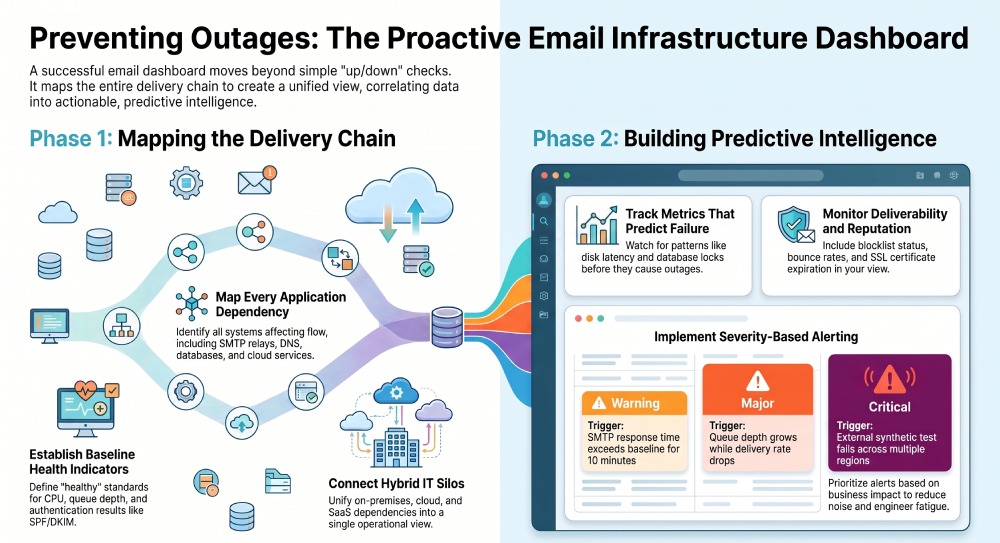
Start with application dependency mapping and application mapping. Identify every system that affects email delivery, including Microsoft Exchange or other mail platforms, Microsoft IIS components, Apache Tomcat applications that generate messages, SMTP relays, spam filters, DNS, Active Directory, PostgreSQL or MySQL databases, and external services in AWS, Azure, or Kubernetes.
For hybrid IT environments, this map is especially important. Email infrastructure often spans on-premises monitoring, cloud monitoring, virtualization monitoring, and SaaS (Software as a Service) dependencies. A single dashboard should connect infrastructure monitoring, server monitoring, application monitoring, database monitoring, and network monitoring into one operational view.
Establish baseline health indicators
A healthy email infrastructure should show:
- Stable email server CPU, memory, disk, and queue depth
- Acceptable SMTP monitoring response times
- Normal database performance for mailbox, logging, and application databases
- Clean authentication results for SPF, DKIM, DMARC, and TLS
- Consistent network performance between mail components
- No abnormal security event monitoring activity
- Predictable server capacity trends
- Successful end-to-end monitoring for sent and received test messages
This is where observability matters. Traditional monitoring software may show whether a service is up, but monitoring and observability together help explain why performance is degrading. Tools such as SolarWinds Server Application Monitor, SolarWinds Observability, Network Performance Monitor, NetFlow Traffic Analyzer, Virtualization Manager, and Database Performance Analyzer can help correlate email monitoring signals across infrastructure, applications, networks, and databases.
Track the Metrics That Predict Outages Before They Happen
The best dashboard does not simply announce that the email server is down. It highlights the patterns that usually appear before an outage. Predictive email monitoring depends on collecting metrics from multiple layers and presenting them in a way that helps teams act early.
Monitor server and infrastructure indicators
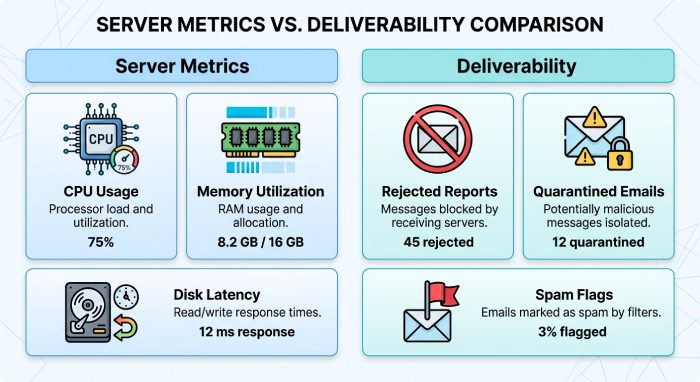
Server monitoring should include CPU saturation, memory pressure, disk latency, volume utilization, service status, mailbox database availability, and process health. Server health monitoring should also track hardware monitoring data such as power supply, disk array, temperature, and hardware error conditions where applicable.
For Windows server monitoring, watch Event Logs, service restarts, patch status, certificate bindings, and Active Directory connectivity. Active Directory monitoring is critical because authentication failures, replication delays, expired service accounts, or DNS issues can look like email server problems even when the mail application itself is functional.
Infrastructure monitoring should also cover virtualization and containers. In hybrid IT environments, an overloaded hypervisor, misconfigured Kubernetes resource limit, or storage bottleneck in Azure or AWS can degrade email infrastructure before users report failures.
Measure application and database performance
Application monitoring should track mail transport services, webmail, mobile access, API (Application Programming Interface) endpoints, and supporting applications. If email is generated by business systems running on Microsoft IIS, Apache Tomcat, or custom services, application performance management and application monitoring software should be included in the dashboard.
Database monitoring is equally important. Mail platforms and connected applications often rely on SQL Server, PostgreSQL, MySQL, or other databases. Use SQL monitoring, database performance metrics, and tools such as SolarWinds Database Performance Analyzer or SQL Sentry to monitor query latency, locks, deadlocks, transaction log growth, and storage waits. For the PostgreSQL side specifically, tracking what’s actually running against the database in real time catches long-running queries and lock waits before they back up into stuck mail queues. Poor database performance can create delayed notifications, stuck queues, and failed application-generated emails even when the email server is online.
Add response time and transaction checks
Response time monitoring gives teams an early signal when users are about to experience problems. Track SMTP banner response, authentication time, message submission time, mailbox access time, and external delivery time. Digital experience monitoring and user experience monitoring can validate whether users can actually send, receive, search, and open messages.
For stronger email monitoring, add synthetic transactions: send a test message through the same route used by production systems, confirm delivery, verify headers, and alert when latency exceeds the baseline. This creates end-to-end monitoring instead of isolated component checks.
Monitor Deliverability, Authentication, and Reputation Signals
Email infrastructure can be technically “up” while still failing the business because messages are delayed, rejected, quarantined, or marked as spam. A dashboard that prevents outages must include deliverability and trust signals, not just server monitoring and application monitoring.
Track SMTP, DNS, and certificate health
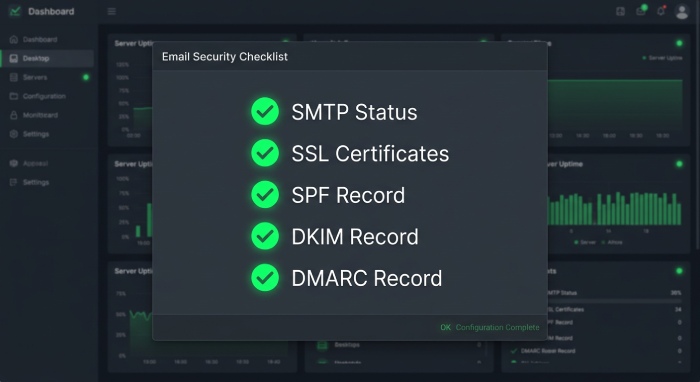
SMTP monitoring should validate port availability, TLS negotiation, relay behavior, error codes, and queue growth. SSL monitoring should track certificate expiration, hostname mismatch, protocol support, and weak cipher exposure. DNS checks should validate MX, SPF, DKIM, DMARC, PTR, and CNAME records.
Network configuration changes can also break email delivery. A firewall rule, NAT update, DNS edit, or IP address conflict may affect transport. Tools such as SolarWinds Network Configuration Manager, IP Address Manager, Engineer’s Toolset, and Network Topology Mapper can help teams verify network configuration and topology changes that affect email infrastructure.
Watch reputation and security signals
Reputation issues can silently damage outbound delivery. Include blocklist status, bounce rates, spam complaint rates, DMARC alignment failures, rejected relay attempts, and abnormal sending volume. Security Event Manager and Kiwi Syslog Server can centralize log management and security event monitoring for suspicious authentication patterns, compromised accounts, and unexpected relay activity.
Access Rights Manager can help with permission oversight, especially where Active Directory groups control mailbox, relay, or administrative access. File monitoring may also be useful for detecting unexpected changes to configuration files, certificates, scripts, or mail gateway rules. If sensitive files or reports move through secure transfer workflows, Serv-U Managed File Transfer can become part of the broader infrastructure solutions view.
Design Alerts That Reduce Noise and Trigger Action
A dashboard only prevents outages when alerts are accurate, prioritized, and actionable. Many email monitoring programs fail because every threshold violation creates a ticket, eventually training engineers to ignore noise.
Use severity-based alerting
Design alerts around business impact and failure progression. For example:
- Warning: SMTP response time exceeds baseline for 10 minutes
- Major: Email server queue depth grows while delivery rate drops
- Critical: External synthetic test fails across multiple regions
- Critical: Database monitoring shows storage saturation affecting mail transport
- Security: Unusual authentication failures or relay attempts detected
This approach connects infrastructure monitoring, server monitoring, application monitoring, and database monitoring to operational risk. Alerts should include affected services, dependency context, likely causes, diagnostics, and recommended actions.
Correlate events before paging engineers
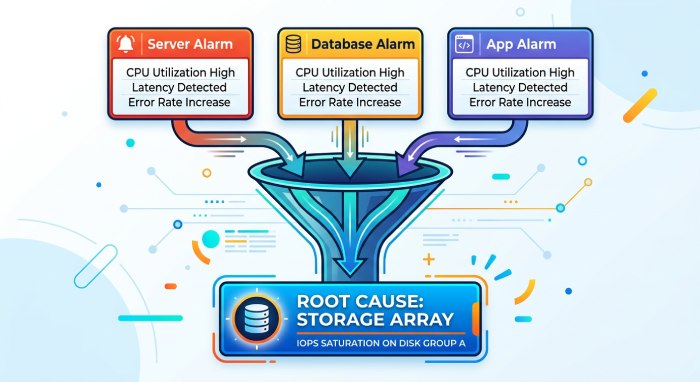
Use observability to reduce duplicate alerts. If a storage array causes high disk latency, the email server, database, and application may all alarm at once. Correlation prevents five separate pages and points engineers to the root cause.
SolarWinds Observability, Server Application Monitor, Network Performance Monitor, NetFlow Traffic Analyzer, Virtualization Manager, and Database Performance Analyzer can support enterprise monitoring by bringing telemetry into one view. For teams using SolarWinds Service Desk or Web Help Desk, alerts can create incidents automatically, attach diagnostics, and route work through IT service management or broader service management workflows.
Include automation and ownership
Every alert should have an owner, escalation path, and runbook. IT automation can restart a non-critical service, collect logs, run a connectivity test, or open an incident response workflow. Dameware can help remote administrators access affected systems, while the THWACK User Community can provide practical templates, scripts, and operational examples from other SolarWinds users.
Turn Dashboard Insights Into Incident Response and Continuous Improvement
The final purpose of an email infrastructure monitoring dashboard is not visibility for its own sake. It is faster incident response, fewer repeat incidents, and better operational resilience.
Connect monitoring to incident response
When email monitoring detects a real service impact, the dashboard should support incident response immediately. That means showing the affected email server, impacted users, dependency map, recent changes, active alerts, logs, performance history, and probable root cause. Incident response software should also record timestamps, assignments, communications, and remediation steps.
For mature Incident Response and IT Service Management practices, integrate monitoring software with SolarWinds Service Desk, Web Help Desk, or your existing IT service management (ITSM) platform. This helps teams move from detection to triage, escalation, communication, and resolution without manually copying data between systems.
Use post-incident analysis to improve the dashboard
After every major incident response event, review whether the dashboard predicted the problem. Did server monitoring show resource exhaustion early enough? Did application monitoring detect degraded webmail or API behavior? Did database monitoring reveal query waits or storage pressure? Did infrastructure monitoring catch a virtualization, network, or cloud dependency?
Use those answers to tune thresholds, improve application dependency mapping, refine network monitoring, and update runbooks. Add missing metrics, remove noisy alerts, and adjust server capacity forecasts. This continuous improvement loop turns email monitoring into an operational discipline rather than a static display.
Build a unified operational view
The strongest dashboards combine performance monitoring, cloud monitoring, premises monitoring, asset management, log management, and security context. In hybrid IT, no single metric explains everything. Email infrastructure depends on identity, compute, storage, databases, network paths, certificates, applications, and external reputation.
A practical dashboard should show the current state of email infrastructure at a glance, while still allowing deep diagnostics when something goes wrong. By combining observability, server monitoring, application monitoring, database monitoring, and disciplined incident response, teams can detect risk earlier, respond faster, and prevent email outages before they disrupt the business.
General Manager
General Manager at DuoCircle. Product strategy and commercial lead across the email security portfolio.
Secure your email infrastructure
Protect, authenticate, and deliver. Contact our team to find the right solution.